A Slay the Spire 2 Bot (3): 8 A/B Tests Told Me Nothing — So I Built a Boss Simulator and Settled It in 25 Minutes
Five hours of testing on the live game couldn’t tell me whether an improvement I’d put into the bot was actually working. So I switched to a homemade simulator that reproduces just the boss fight — and in 25 minutes I had confirmation that it works. The probability of seeing a gap this large by chance alone, with no real effect (the p-value), was 0.0001. On the very question the live game had returned “inconclusive” for, no matter how many times I ran it.
This time isn’t a story about making the bot stronger. It’s a story about making it possible to measure whether it got stronger. As I found out by doing it, half the work of building a bot was building the “instrument,” not the bot itself.
What this is about
The story so far (through part 2): I’m building a bot that auto-plays Slay the Spire 2 (a roguelike where you fight with cards), together with Claude Code (an AI coding agent). I’d gotten this far: tuning numeric parameters did nothing across all six knobs I tried, and the only thing that worked was reworking the combat procedure to “defend only as much as you need and pour the rest into attacking.”
The next wall is the first major boss. The bot can reach it but can’t beat it. The star of this post is the wall just before that one — a much more mundane wall: “you can’t even tell whether an improvement worked in the first place.”
Prologue: the boss was fighting outside my assumptions
First, I wrote a tool that pulls just the boss fights — 64 of them (8 wins, 56 losses) — out of past match logs and dissects them. Round by round, it compares “the damage actually dealt” against “the maximum damage that hand could have dealt.”
The first finding was in the logs. It fired attacks for 9 and 12 damage, yet the boss’s HP went 173 → 172 → 171 — dropping by only 1 each time. The boss had a buff called Slip, which replaces its first 8 instances of HP loss with 1. Since the bot runs on the straightforward rule “play the most damage-efficient card first,” it was feeding its highest cards into that shield in order. Damage wasted to Slip came to an average of 61 and a max of 175 across the 24 fights examined.
The second finding was outside the logs. Watching the bot play, I saw it firing Bash (a card that applies Vulnerable, which makes the target take 50% more damage) dead last every time. Apply Vulnerable first and everything after it hits for 1.5×, yet the bot was tacking it on only after it had finished swinging.
Yet the first version of the autopsy tool reported that “the bot’s play is near-optimal, at 92% of the theoretical max.” When I pointed it out and had it re-check, the analysis side hadn’t been counting status effects like Vulnerable and Strength. Fixed, the efficiency dropped to 82.5%, and it turned out only 11% of total damage had benefited from Vulnerable. In 51% of the 43 rounds where it played Bash, a plain attack came out first.
The situation also differed by boss. Here’s the table the autopsy tool produced (Actual dmg/R = damage actually dealt per round; Needed dmg/R = damage that would have been needed to win).
| Boss | Record | Loss efficiency | Actual dmg/R | Needed dmg/R | Slip tax |
|---|---|---|---|---|---|
| Vantom | 3W 21L | 0.90 | 13.4 | 28.3 | avg 64 |
| the Ritual Beast | 5W 12L | 0.68 | 19.4 | 36.9 | 0 |
| the Blood Priest | 0W 23L | 0.87 | 23.7 | 55.2 | 0 |
Here’s how to read it. The Ritual Beast sits at 0.68 efficiency — it isn’t getting out the firepower it could have, meaning there’s room to win on play alone. Vantom is high at 0.90 yet carries a heavy Slip tax — a card-ordering problem. The Blood Priest needs more than double the current deck’s damage (it’s actually a 307-HP slog) — a plain shortfall in deck power. The same “loss” calls for three different prescriptions.
The lesson I took here would shape the simulator design later: an instrument that doesn’t know the game’s rules will misread “this is optimal.”
I fixed it — and still couldn’t tell whether it worked
The ordering rules were quick to implement — two of them: apply Vulnerable before swinging, and during Slip, play cheap cards first to strip the shield.
The problem started here. A live A/B test (run the before and after bots 8 times each and compare floors reached) takes about an hour per round. The result: “inconclusive” (p=0.63). Even after bundling in a draft (card-acquisition) improvement and running two more rounds — up to 16 runs each — it was p=0.47. Statistically, nothing to say.
Meanwhile, the substance of the boss fights had clearly changed. The improved version racked up three narrow losses in a row — boss HP at 8, 27, and 30 remaining. Until then, the losses had all been blowouts with 100+ HP left on the boss. It was one push away, and I couldn’t prove it with numbers.
Laying out the cause: the live test was structurally unsuited to this question.
- The evaluation metric, “floor reached,” caps out at the boss wall (floor 17); any difference beyond that doesn’t show unless you actually beat the boss
- Boss fights themselves occur only 2–4 times per test, and which boss you draw is luck too
- Detecting a difference in kill rate needs, by rough estimate, 50+ boss fights per side — which on the live game works out to over 10 hours of cumulative runtime
Here I stopped the improvement loop for a moment. Rather than keep tinkering with the bot, I decided to fix the instrument first.
Designing the simulator — three decisions
Reproduce just the boss fight inside a program and run it thousands of times. I settled three things before building it.
1. Don’t rewrite a single line of the bot’s decision code. I made the simulator emit state data in exactly the same format as the game mod (the modification program through which the bot receives game state as JSON-format data). The real decision code reads it, returns a real action, and the simulator computes the result. This way, “strength in the simulator” and “strength on the live game” are about the same code. It structurally prevents the accident of measuring some rewritten, test-only variant instead.
2. Don’t write the enemy AI. Guessing at the boss’s behavior rules and implementing them would repeat the same mistake as with Slip. Instead, I mined the enemy’s action sequences (per round, how many attacks of how much damage) from 90 past fights and replay them as-is, like a script. Replaying real measurements leaves no room for my guesses to creep in.
3. Kill luck in pairs. Give the two bots you want to compare the same deck, the same enemy script, and the same random seed, then have them fight. Matches where both win and matches where both lose cancel out as “draws,” leaving only the pairs where the result split. All that’s left is to count “when they split, which one wins more often” (the sign test, a classic method). Luck — deck strength, boss draw — vanishes completely in the subtraction.
Card effects are quantified by reading their text (“Deal 8 damage. Apply 2 Vulnerable.” → damage 8, Vulnerable 2). Cards whose effects can’t be parsed are treated as “do nothing,” and I keep an honest count of how many times they were played.
Calibrating the instrument — how close to the real thing?
A simulator isn’t done once it’s built; you measure how far it drifts from reality before using it. I checked the answer in three stages.
| Check | Result |
|---|---|
| Per-move damage-dealt prediction (1,913 moves) | 91.5% within ±3 |
| Enemy-turn damage-taken prediction (515 turns) | 93.2% within ±3 |
| Whole-combat win rate (by boss) | Vantom: sim 11.8% vs actual 8.6% / the Blood Priest: 2.8% vs 0% / the Ritual Beast: 2.3% vs 19.2%, a big miss |
Why only the Ritual Beast is way off is clear: the real decks that beat this boss leaned on special cards like Bedrock and Juggling (unique engines that only one deck each happened to have), and the simulator doesn’t implement them.
It’s still usable as a comparison tool, though. The two bots being compared fight with the same missing engine, so the effect of what’s missing falls equally on both sides and cancels when you take the difference. The rule for using it becomes: don’t trust the absolute win rate; read only the ranking.
The answer, in 25 minutes
Calibration done, I put the question the live game couldn’t settle: is the ordering rule — “apply Vulnerable first, and during Slip play cheap cards first” — working?
It chewed through 4,000 pairs (8,000 fights) in about 25 minutes, and the answer was “yes, it works” (p=0.0001). Kill rate went 7.5% → 8.8%.
uv run python -m game_api.sim.arena --from-report logs/sim-arena/report.json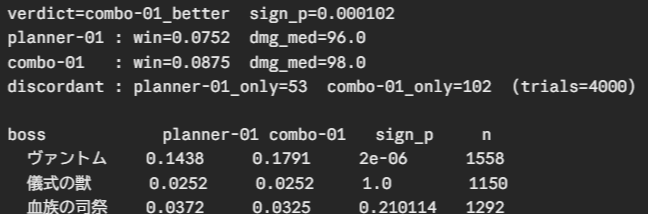
The breakdown was clean. The improvement showed up only on the boss that has Slip (Vantom) — kill rate 14.4% → 17.9% (p=0.000002). A rule designed as a counter to Slip works only on the boss that has Slip. No difference on the other two — which also matches the autopsy’s predictions (Vulnerable does nothing during Slip; the Blood Priest is a 307-HP war of attrition where the deck simply lacks the firepower). It was the moment design and measurement clicked together. The most surprising thing all day was that an answer five hours of live runs couldn’t produce really did fall out in 25 minutes — that fact itself.
The speed math is simple. The live game takes minutes per boss fight; the simulator, about 0.2 seconds per fight. The code doing the deciding is the same in both.
Limits, and what’s next
An honest set of caveats.
- This instrument can’t measure draft differences. Because it’s designed to fight with the same deck, only differences in in-combat decisions show up. The quality of deck-building has to be measured some other way
- Absolute win rates come out more conservative than on the live game (the Ritual Beast especially) — that’s the unimplemented cards
- And the boss that matters still isn’t going down reliably. Kill rate in the simulator runs 2–18% depending on the boss
Next, I’ll use this instrument to settle another combat rule I’d shelved as inconclusive on the live game — a “race mode” that drops defense in boss fights and swings to close out the kill. On the deck-building side, I think it’s the turn of an LLM (large language model) to read card text and judge what to keep and what to cut.
By Tomoki — 20 years of coding; still a hands-on engineering manager and data scientist, specializing in data platforms and AI workflows.